3 types of Japanese candles to check when analyzing a candlestick chart Analyzing the types of Japanese candles that form price trends is a main task for the technical analyst.
There are many types of Japanese candles, also called candlesticks and today, we will see what you need to know about them because they can significantly move the price.
Although a single candle can hardly be used as the only operating tool when trading, knowing the most famous types of Japanese candles can help us optimize our operations in the financial markets.
I want to explain all kinds of candles that produce interesting and exploitable price movements, let’s see right away.
The 3 types of Japanese candles you need to check when analyzing a candlestick chart
Relying on the types of candle patterns identified on the chart for trading is never a great idea, but the types of Japanese candles we will see today can perform well even on their own, my advice is to link them to other price analyses and all indicators/oscillators.
The types of Japanese candles you will learn to use are three, let’s start with their explanation of the candlestick directly on technical analysis charts.
THE MARUBOZU CANDLE: Directional price explosion and increasing volatility
The types of Japanese candles called Marubozu are candles with a very wide body and no shadows.
BULLISH MARUBOZU CANDLE: The opening coincides with the session low and the closing with the high.
BEARISH MARUBOZU CANDLE: The opening coincides with the session high and the closing with the low.
The image shows you the two types of marubozu candlestick.
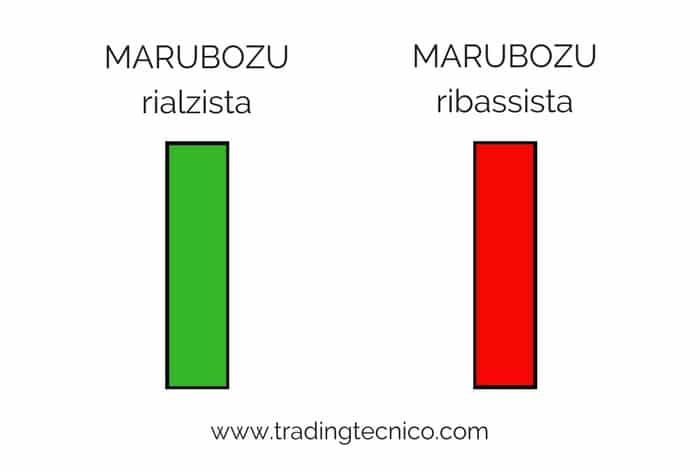
As you can see, the Marubozu candles have no upper or lower shadows and their body is very wide.
This type of candle communicates a clear signal of the new price direction, whether up or down, the concept does not change: the price has given a strong directional signal!
Often, we find the Marubozu candle coinciding with breakouts or rejections of support or resistance levels on the chart.
The signals generated by this type of Japanese candle have a throwing value.
Let’s see some examples of these types of Japanese candles on real charts.
Let’s start with an example where the Marubozu candle emerged in contact with a static resistance, in this case, the price did not break the resistance but was rejected, giving a clear signal that this resistance is very strong.
The direction of the price after the Marubozu candle is clear and defined.
PS: If you notice a small shadow on the candle, concede to me, the concept does not change, although the Marubozu with small shadows would be called by another name, I could not find valid examples.
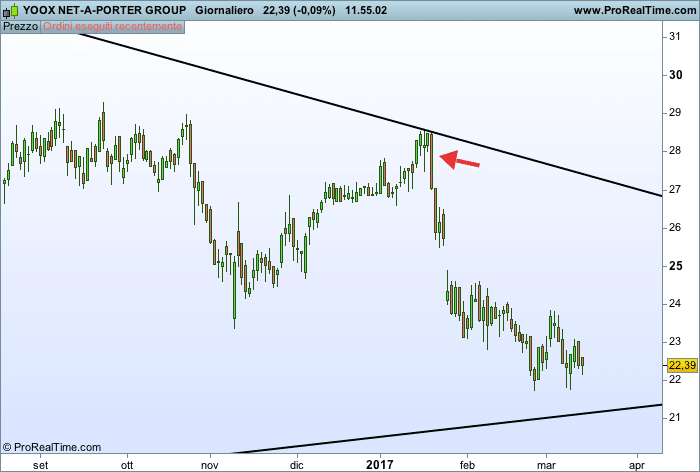
The Marubozu was created by the price near a resistance, in this case, it did not break to increase the area but was pushed down.
This type of candle gave us a clear signal about the next direction of the price, in fact, as you can notice, the descent was decided and continues downward.
I mentioned the explosion of volatility that comes from this type of Japanese candle, if you check the price range before the Marubozu, you will realize that the average volatility was certainly lower than when the candle emerged.
Just visually calculate how small previous candles were compared to the Marubozu to realize that the volatility exploded, giving even more value to the identified Marubozu.
What should we do once we find a Marubozu type candle on the analyzed chart?
What to do when you find a MARUBOZU candle on the chart
If you find this type of Japanese candle and you are considering opening a position on the analyzed instrument, at a minimum, you must operate in line with the direction of the Marubozu.
At the moment these types of Japanese candles emerge, the price seems to have decided the future direction to take.
If you have open positions in the same direction as the candle, you can approach the stop loss just behind the Marubozu’s low/high, depending on the direction, this is generally a good level where trading does not add up.
If you have open positions against the direction of the Marubozu, evaluate closing the trade or at least approaching the previously set protective stops. As mentioned above, the price has indicated the new way to go.
THE HAMMER CANDLE: A type of Japanese candle to take advantage of price reversals
The Hammer is one of the types of Japanese candles useful for exploiting price reversals, whether bullish or bearish.
This type of candlestick is quite easy to recognize, it looks like the image below.
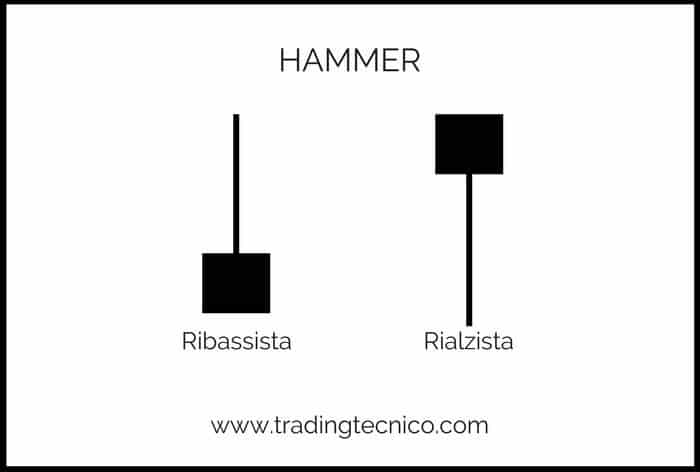
I did not color the body because it is not important in these types of Japanese candles.
The things you need to consider to play the hammer are two, I will tell you right away.
TWO factors to consider when observing a hammer candlestick
The two factors you need to take into account when looking for a Hammer candle are:
- The size of the upper/lower shadow (depending on the type of hammer): must be at least twice the body
- The absence of the lower/upper shadow: must be absent or very small
These are the two factors to consider when looking at these types of Japanese candles.
there is still one last factor to consider, however, the context in which they are stated on the chart It is not.
The validity of individual Japanese candles always depends on the context in which they emerge.
The Hammer candle being a reversal candle will only be valid when it emerges at the end of a bullish or bearish trend, and near supports and resistances. Outside of these contexts, individual candles lose their validity.
Let’s take a look at this type of Japanese candle on a candlestick chart.
The chart shows how the Hammer candle reversed the price direction, in this case, the candle had bearish implications emerging at the peaks of a bullish trend.
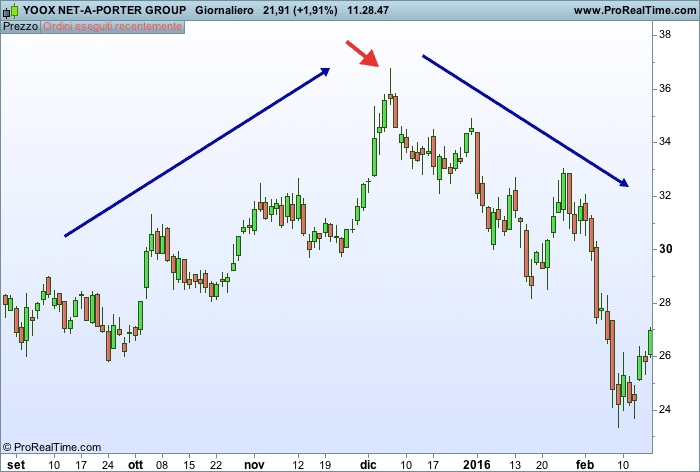
As you can see, the bullish trend was reversed after the price marked a hammer with bearish implications.
The candle respects the parameters we need to consider to validate it (shadows and body), and the price decisively reverses its path. The bullish trend shifts to bearish after examining the candle.
This is just one example, it was always all simple, so I would be a billionaire 😉 The reality is a bit more complicated.
If we dive into the candlestick analysis, we see these types of Japanese candles also in other situations, but they do not always produce the expected reversals.
Observe again the same image.
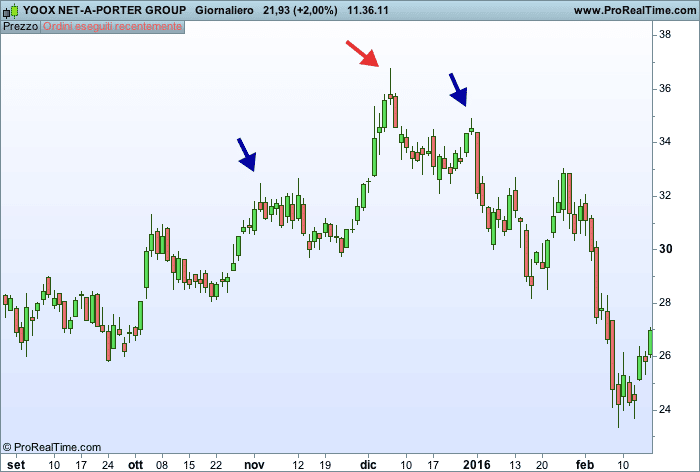
On the same chart, we see that there are two other potential bearish hammers.
In the candle on the left, the price, despite being in a potentially reversed bullish trend, did not decisively reverse its path, but only lateralized for a while.
In the second candle, instead, we see how the bearish push (started by the first hammer at the top) violently restarted (the next candle is similar to a Marubozu).
All this serves to emphasize that just the analysis of Japanese candles will hardly lead you to continuously win, although from the examples shown, you might almost think so.
In any case, according to the principles of technical analysis, the entry for a bearish trade should be made when the price violates the low of the Hammer candle, the stop loss would go beyond the high.
Below, I show you an example of a bullish hammer, same speech but the parts reversed.
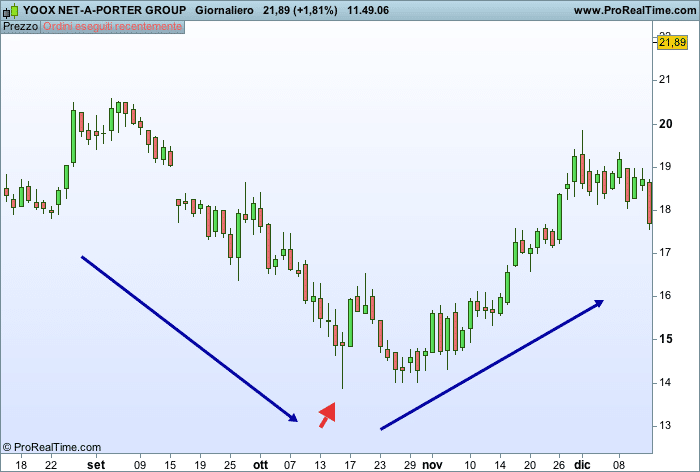
In this case, the Hammer candle reversed the bearish trend, even if the actual reversal started a few candles later, we still had a very useful first warning signal.
THE TRUTH OF THE
We often insist on looking for particular meanings in all kinds of Japanese candles that we observe on price charts, but we can synthesize it all in a few simple words.
The bearish hammer candle has a clear and explicit meaning, the body and the shadow communicate it: the bullish push has exhausted itself in today’s session.
Why complicate our lives?
We see the body of the candle small and located at the bottom, the shadow very extended upwards means that in the session the bullish pushes attempted a stretch but in closing the bearish won the battle, bringing the close near the lows, or in any case in the lower part of the candle.
Reverse but identical discourse for the bullish hammer.
DOJI CANDLES: Indecision on the next price direction
Doji are types of Japanese candles expressing indecision on the part of the price, the battle between bulls and bears has not yet been concluded.
Doji candles can be of 4 types.
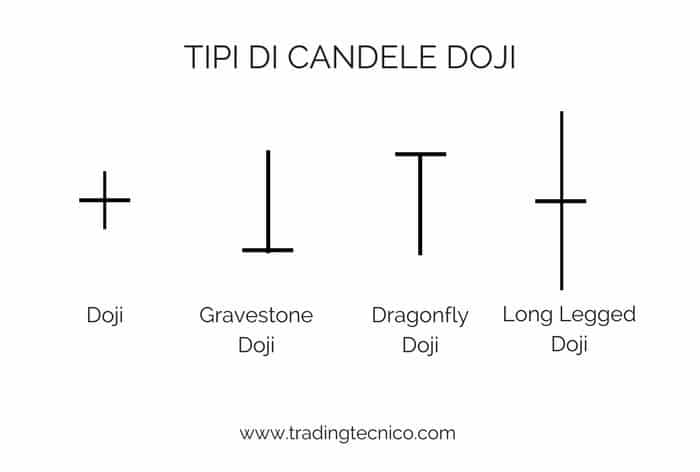
These are candles where the opening is very close to the closing level and the shadows are definitely pronounced.
Different types of Doji candles vary depending on where the opening/closing level is compared to the shadows.
In any case, we are interested in knowing the main message that comes from these candles: the price is indecisive about the next direction.
What to do when you find a Japanese Doji type candle on the candlestick chart
The indecision regarding the future direction of the price should lead us to do two things: understand it (as always, on the other hand), and check critical levels on the price’s path.
Let’s see an example.
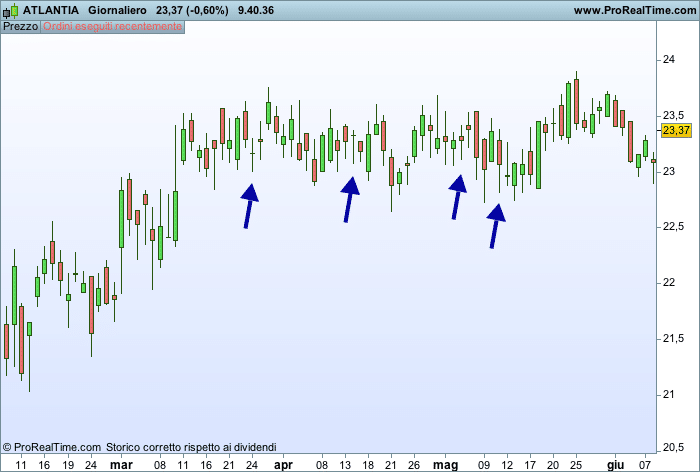
In the chart, we can see the types of DOJI candles in a lateral pattern.
After a period of rising, the price started to lateralize and the Doji candles began to emerge. I marked a few but there would be more.
In these cases, the right operation is to wait for the price to resume the main path, upwards or downwards.
As we said, these types of Japanese candles express indecision about the future direction, unsurprisingly, we see them in a lateral period.
In this case, we draw the price congestion area and wait for the breakout, as in the image below.
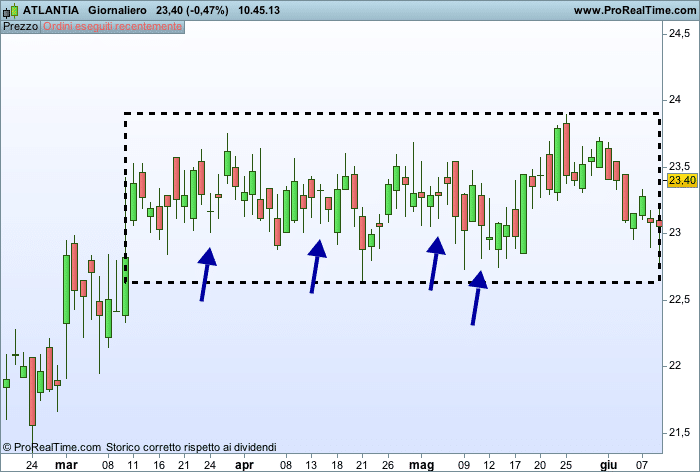
I drew the rectangle where the price trend is locked to get an immediate operational reference.
There are market entry techniques on the violation of key levels on the chart, you can read them in this article: trading strategies.
In the table below, you can see how a Doji candle stopped the price rise, the timeframe is weekly so it also has greater value.
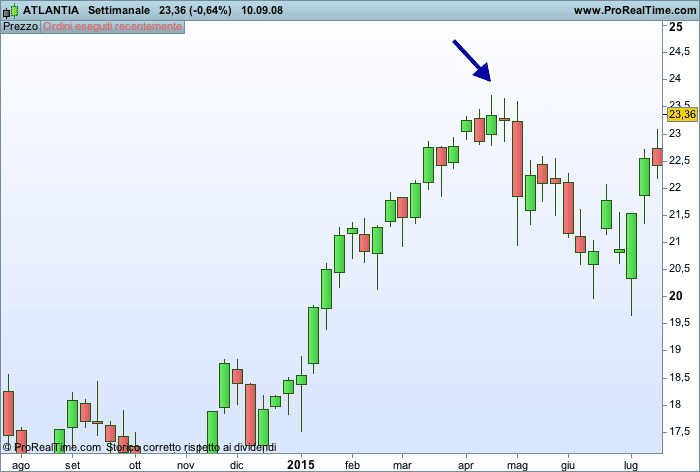
In case we are at the peaks of a bullish trend, and a Doji candle emerges, we must bring the stop losses closer if we have long positions open.
Same conversation for the bearish trend with short positions.
If we were looking for a potential bullish entry, we must delay because the price is not very convinced of continuing upwards.
Consider all kinds of Japanese candles for your next trades
All the types of Japanese candles we have seen today often appear on the stocks and charts of financial instruments for trading, always remember to analyze the context in which the candle emerges.
Using only Japanese candles as an operating tool is certainly limiting, but surely knowing the most popular and performing types can help your trading operations.
If you want to learn how to use candles as a method of operation, you can rely on patterns, technical analysis figures formed from sets of individual candles, take a look at this article: technical analysis figures, which are also patterns formed by the types of Japanese candles we have seen in this article.
In the next article, I will try to delve into the different types of candles and other aspects to consider when you find them on the price, stay updated on the blog 😉
Tag: decorating with candles